Photoplethysmography for cardiovascular health monitoring
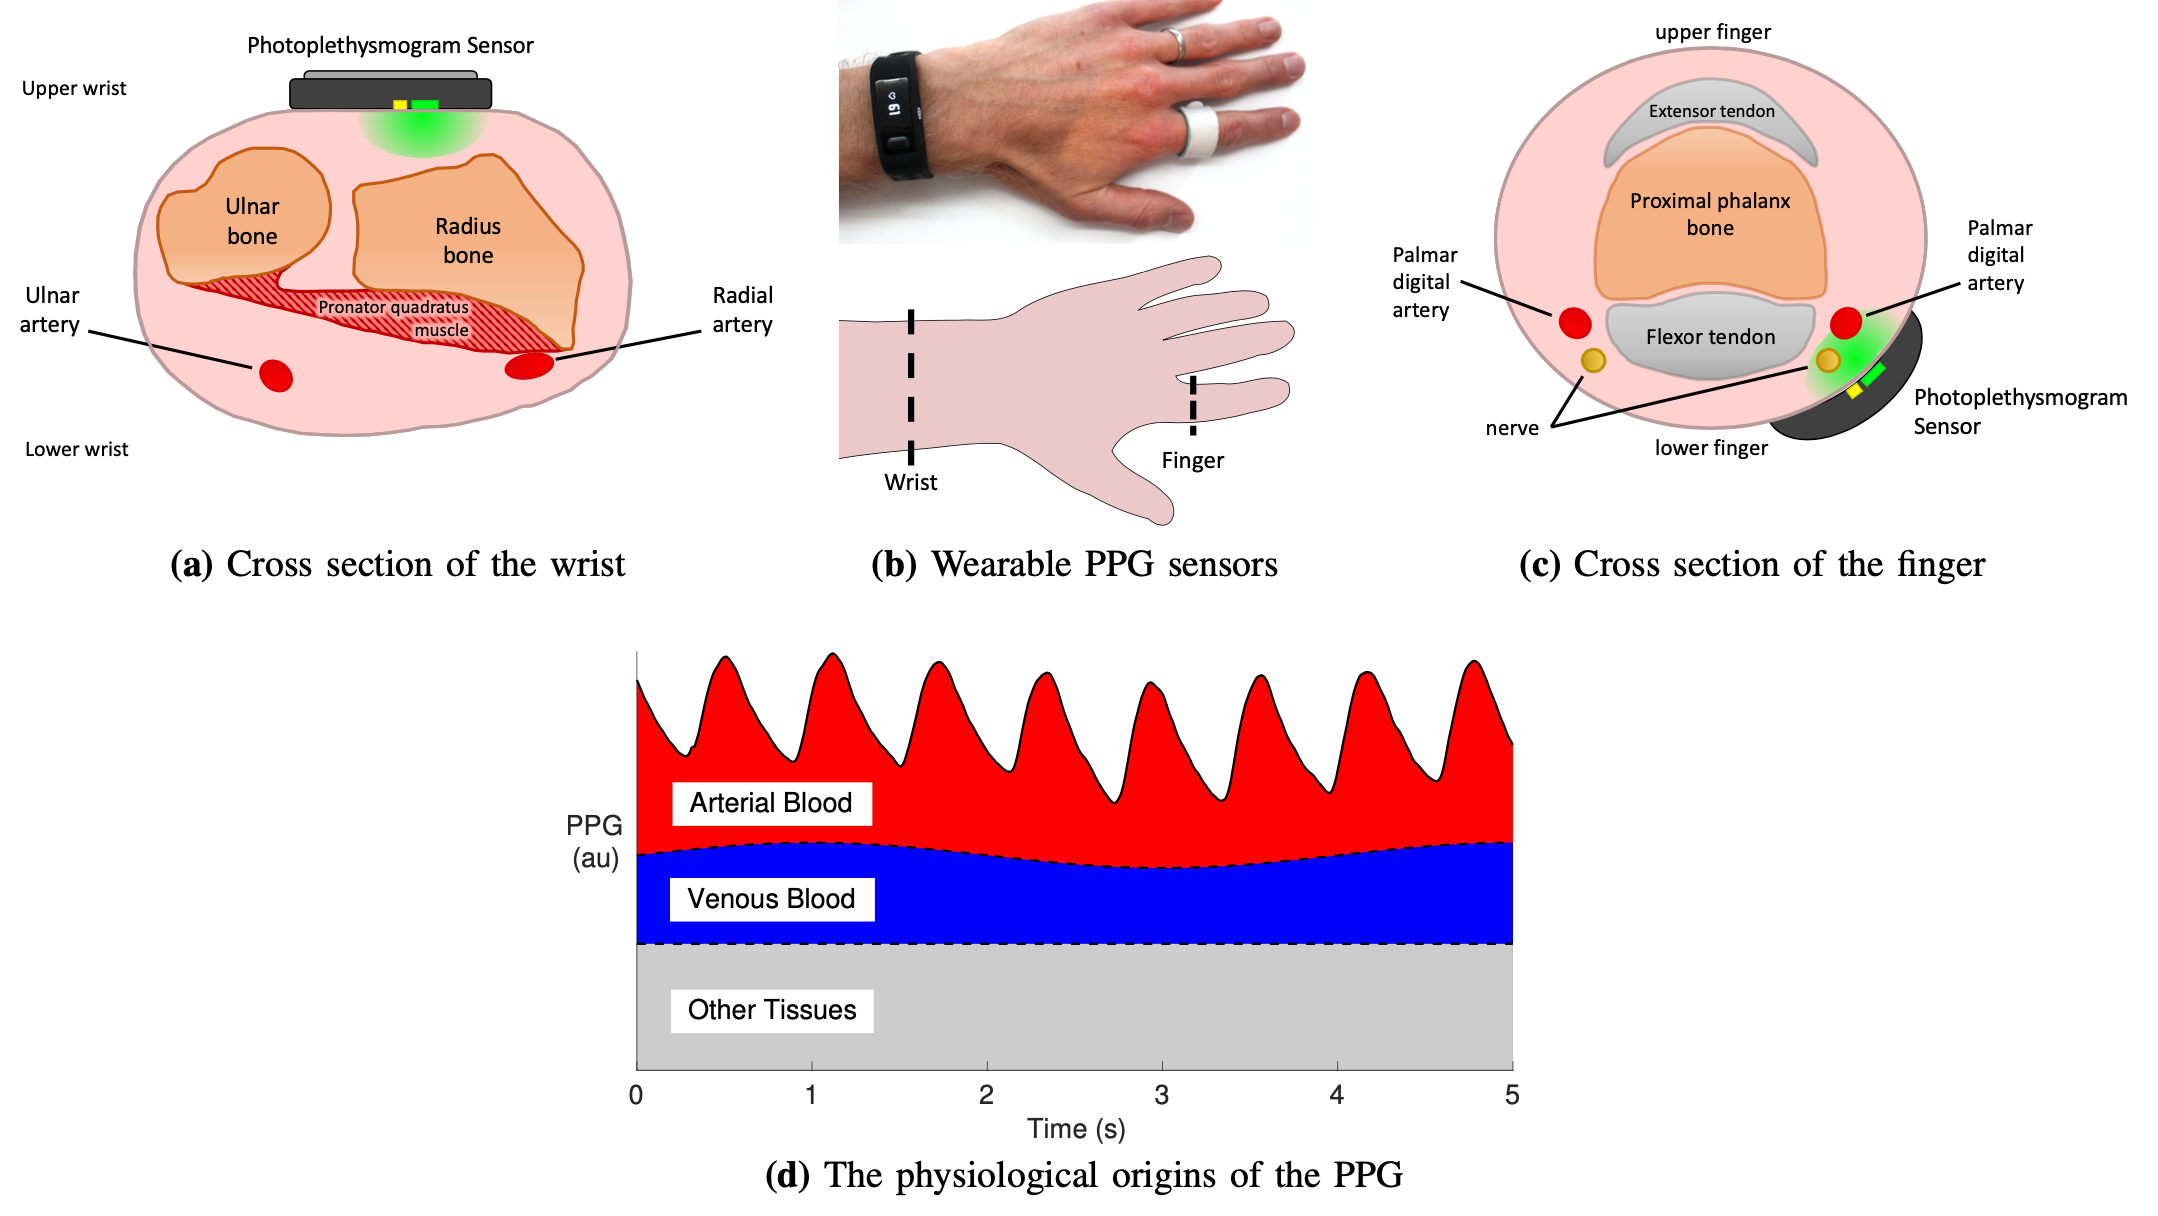
Smart wearables like fitness bands and smartwatches routinely monitor the photoplethysmogram (PPG) signal, an optical measure of the arterial pulse wave strongly influenced by the heart and blood vessels. The PPG is emerging as a potential tool for cardiovascular (CV) monitoring in daily life and informing clinical decisions (Proc IEEE, 2022).
 We have contributed to this field of research by showing that:


We have contributed to this field of research by showing that:
- Acquiring PPG data during daily living is feasible through the publicly available "PPG Diary Pilot Study" (Eng Proc, 2020);
- Signal averaging increases the signal-to-noise ratio in devices with multiple PPG sensors at the same measurement site (Healthc Technol Lett, 2020);
- Physics-based computational blood flow modelling enables the simulation of PPG signals (along with pressure, flow, and area pulse waves) at different body sites in the human with ageing (Am J Physiol, 2019) and disease (Symmetry, 2021), as well as in the rabbit with changes in endothelial function (J Biomech, 2009);
- Datasets of PPG signals containing precise theoretical values for CV parameters facilitate (i) studies of the CV determinants of the PPG wave shape and (ii) algorithm development (JRSM Cardiovasc Dis, 2024; Proc IEEE, 2022; Symmetry, 2021; Healthc Technol Lett, 2020; Am J Physiol, 2019; Proceedings (MDPI), 2018; J Biomech, 2009)
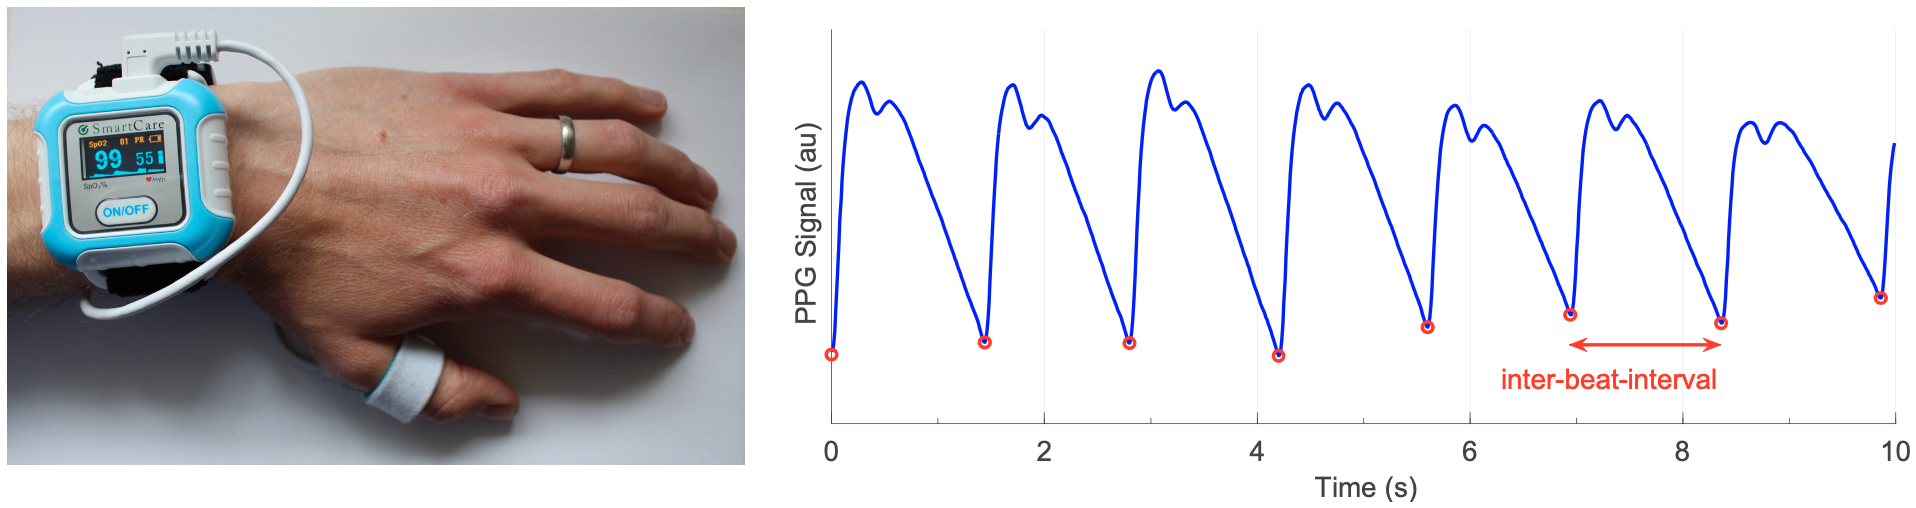
- PPG waves reveal information beyond heart rate when morphology is analysed. We have explored two techniques: (i) identifying fiducial points and estimating physiological parameters from them (Physiol Meas, 2018) and (ii) projecting windowed time-series data into a two-dimensional space using Symmetric Projection Attractor Reconstruction (SPAR) (JRSM Cardiovasc Dis, 2024);

- PPG wave morphology changes with age and physical activity (JRSM Cardiovasc Dis, 2024);
- PPG-based indices exhibit promise for daily monitoring of vascular ageing under minimised noise disturbances (Am J Physiol, 2023);
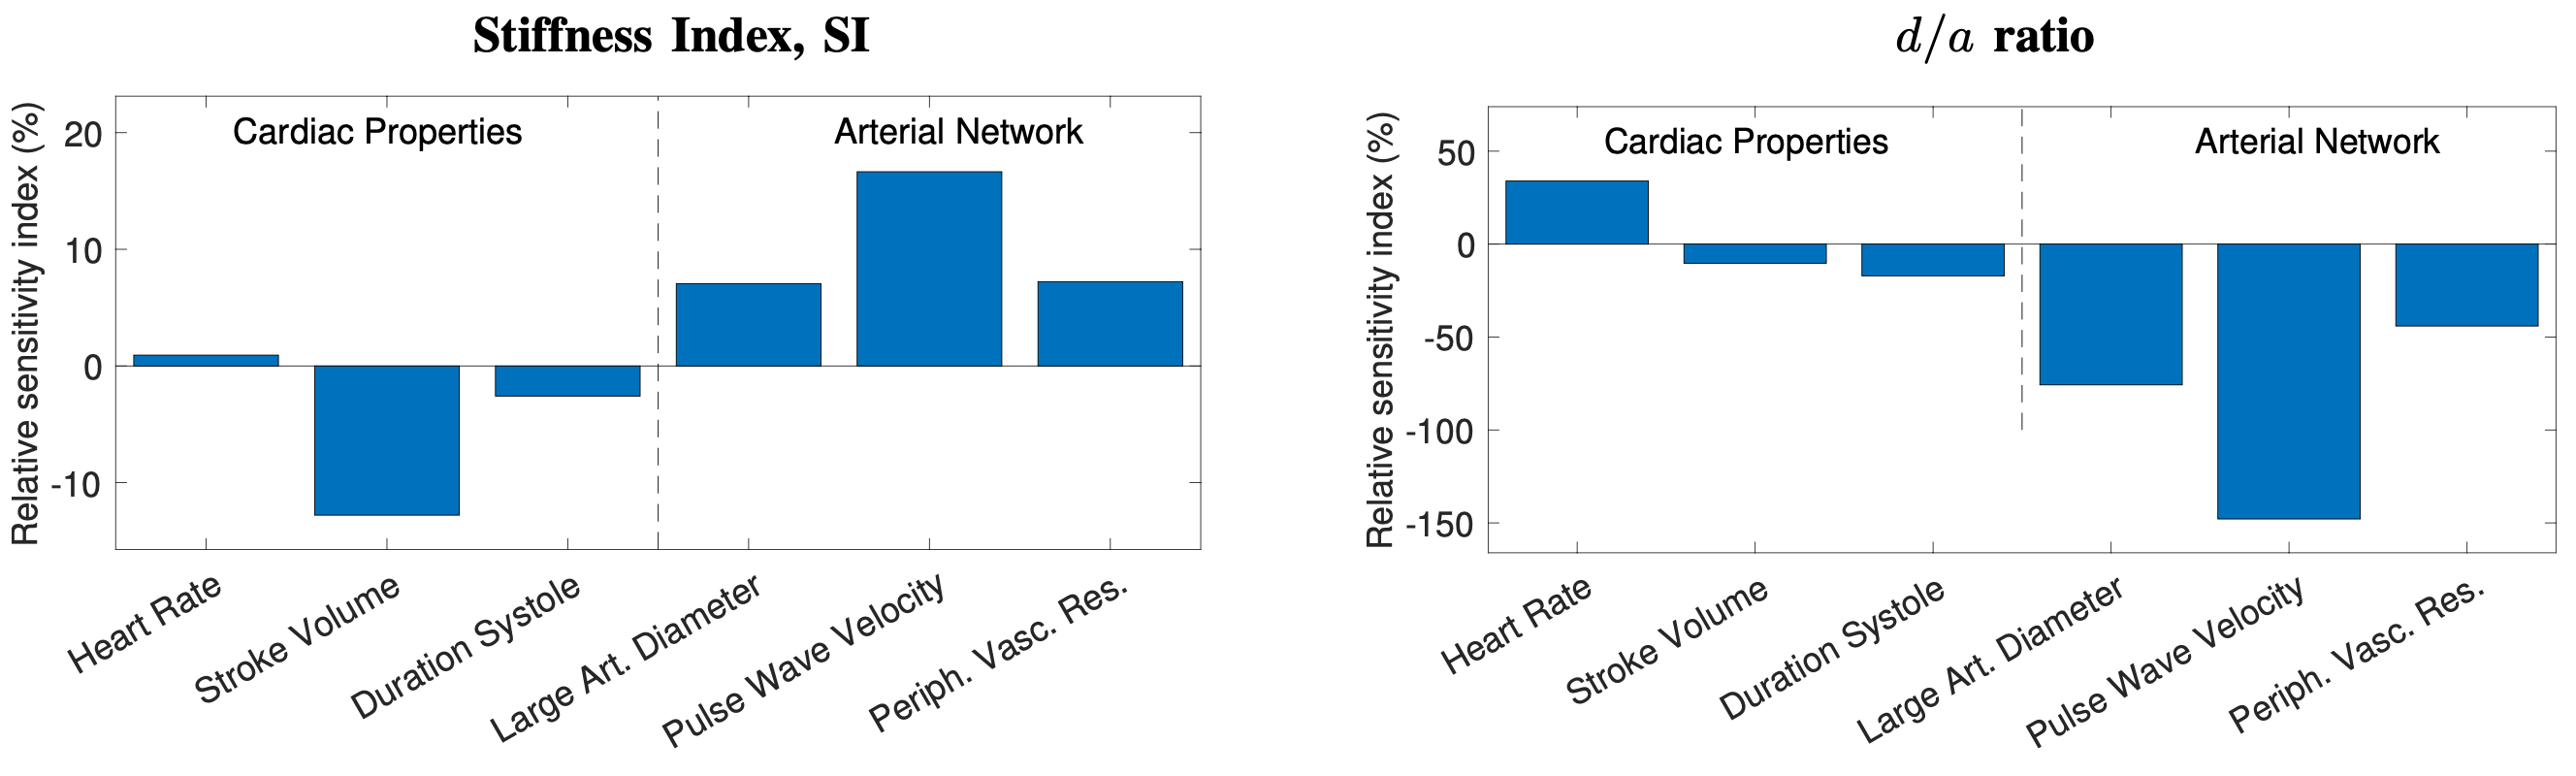
- The stiffness index (SI) and the d/a index (which have been suggested as CV risk indicators) are influenced by other CV risk factors, namely blood pressure and pulse wave velocity, which may explain their potential utility for assessing CV risk (Proc IEEE, 2022);
- Vascular recovery rate after intense exercise may be measured from the PPG (Proc. MDPI, 2018);
- Changes in the PPG wave produced by altered endothelial function can be explained by single or combined alterations of blood viscosity, peripheral resistance and compliance, and the elasticity of conduit arteries (J Biomech, 2009);
- The potential of using high-quality PPG sensors to develop a robust technique for PPG-based monitoring of mental stress, which is detrimental to CV health;
- The potential of PPG-based monitoring of left ventricular ejection time (Proceedings (MDPI), 2018) and contractility (Int J Numer Meth Biomed Engng, 2022; Proceedings (MDPI), 2018), which plays a key role in raising pulse pressure in hypertension (Front Cardiovasc Med, 2023).
- A survey that summarises the fundamentals of wearable photoplethysmography and its analysis, identifyies its potential clinical applications, and outlines pressing directions for future research to realise its full potential for tackling CV disease (Proc IEEE, 2022);
- A dataset of in vivo PPG signals acquired in daily life conditions (Eng Proc, 2020);
- Datasets of in silico PPG signals (alongside pressure, flow, and area pulse waves) for thousands of virtual subjects, with ageing (Am J Physiol, 2019) and abdominal aortic aneurysms (Symmetry, 2021);
- PulseAnalyse: a MATLAB tool for analysing PPG waves (Physiol Meas, 2018). It performs several steps: (i) beat detection, (ii) signal quality assessment, (iii) filtering, (iv) calculating an average pulse wave, (v) calculating pulse wave derivatives, (vi) identifying fiducial points, and (vii) calculating pulse wave indices. This allows non-experts to analyse PPG signals for research;
- A review of techniques to estimate respiratory rate from the PPG (as well as the ECG) (IEEE Rev Biomed Eng, 2018).
Funders